Kiwi Population
Modelling
Capture-recapture analysis, survival modelling, and population projections for Little Spotted Kiwi (Apteryx owenii) across sanctuary sites in the lower North Island of Aotearoa New Zealand.
A closer look
From a single capture-recapture dataset, the platform builds a full population picture — projections, individual trajectories, spatial patterns, and breeding dynamics. Here's what that looks like.
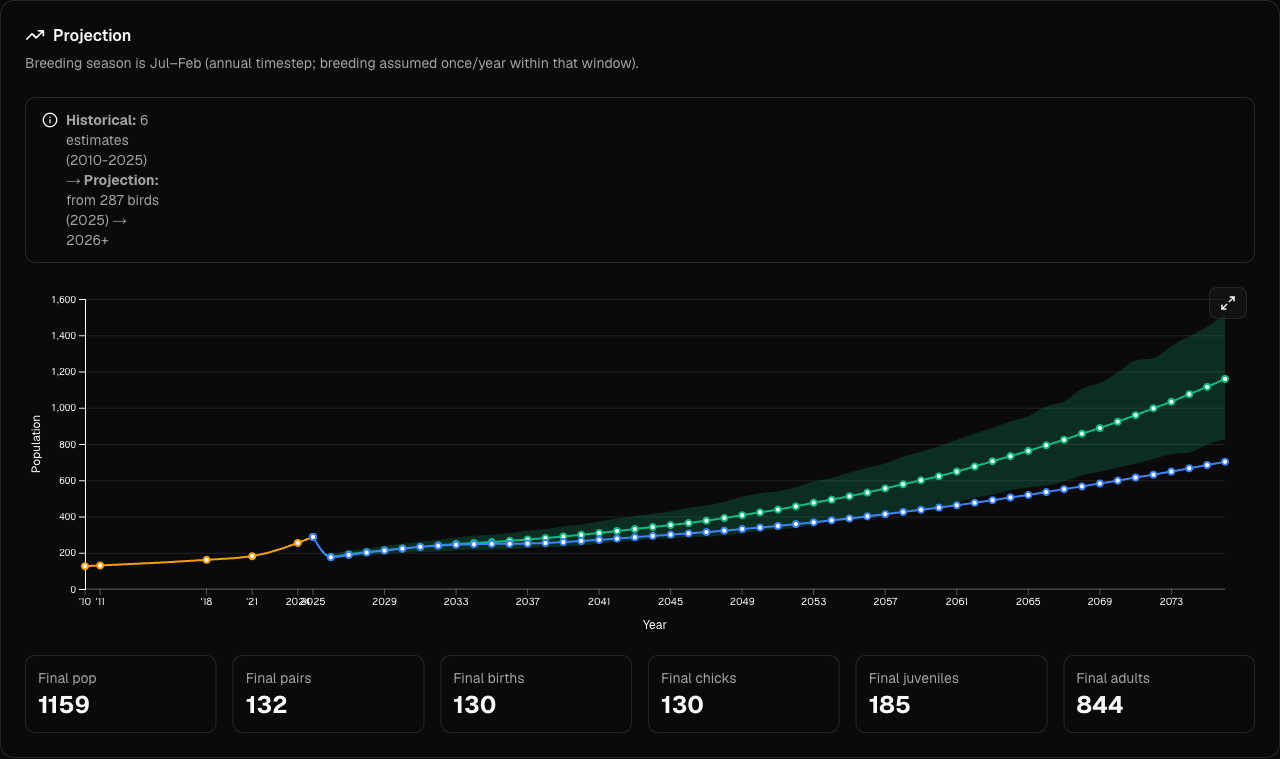
Population projections to 2075
Stage-structured Leslie matrix model projects the population forward 50 years from a Schnabel baseline, with a confidence band and live final-state breakdown by age class.
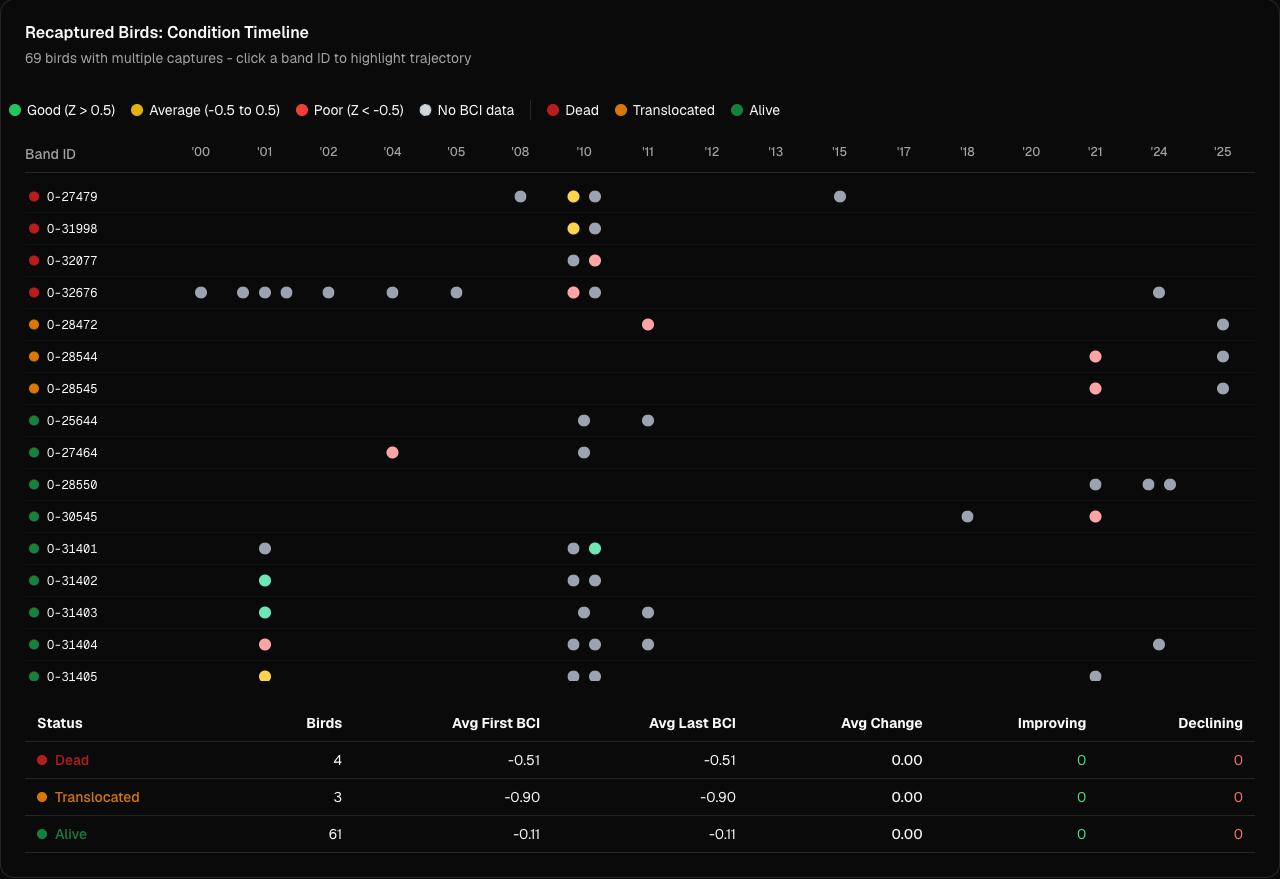
Per-bird recapture timeline
Every recaptured kiwi rendered as a condition trajectory across 25 years — colour-coded by body-condition Z-score, with mortality, translocation, and survival status at a glance.
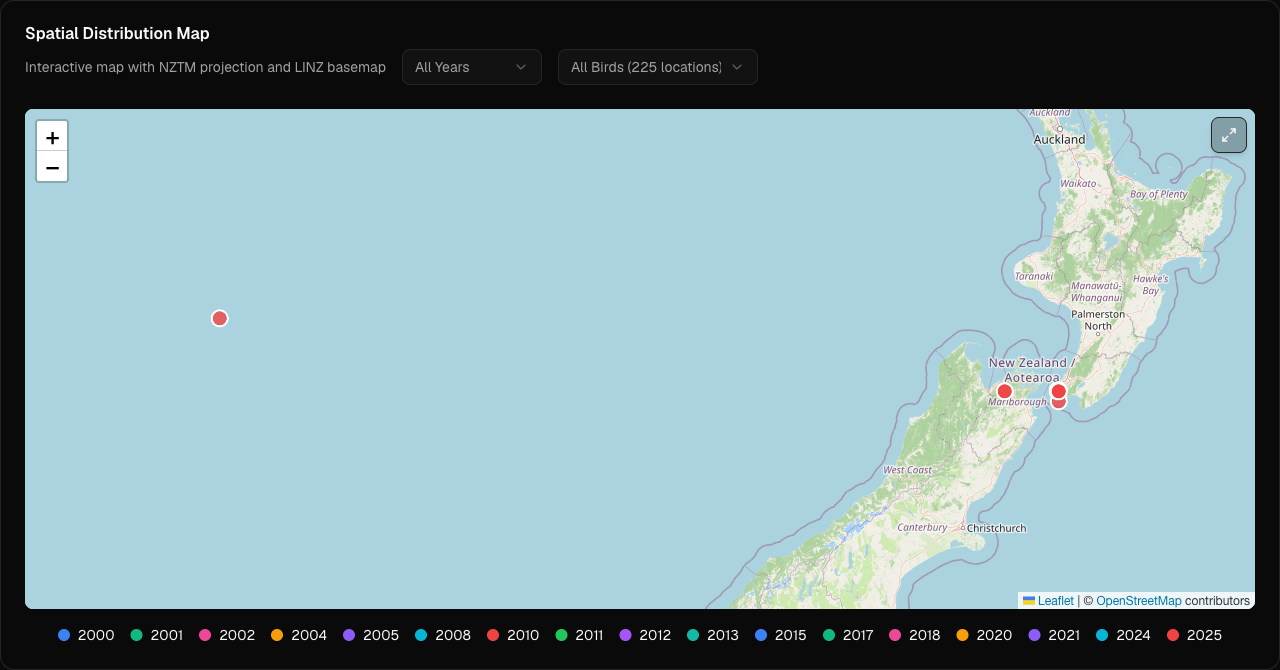
Spatial distribution mapping
Every observation projected from NZTM2000 onto an interactive map, filterable by year and individual — resolving kiwi territories down to the metre across the sanctuary.
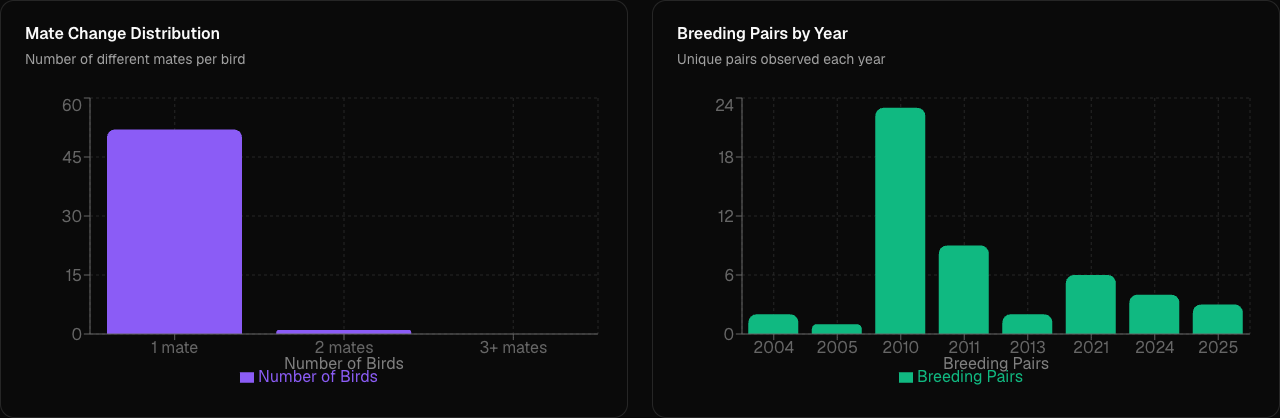
Breeding dynamics
Mate fidelity, pair formation, and breeding pairs per year — quantifying the reproductive engine that drives the projection model.
Analysis Tools
Different estimators for different data. The platform picks the right tool for what you've collected — from a single mark-recapture pair to decades of survey effort.
Schnabel Estimate
Our go-to model. Pools every capture and recapture across many sampling occasions into one robust closed-population estimate with confidence intervals. Best when you have several survey years of marked-bird data.
Lincoln-Petersen
The classic two-sample estimate: mark a batch, resample, and scale up by the recapture fraction (with Chapman bias correction). Best for a quick estimate when you have just one mark-and-recapture pair.
Cormack-Jolly-Seber (CJS)
An open-population survival model. Uses individual capture histories to separate true survival (φ) from detection probability (p), so you learn how many birds were simply missed. Best when birds are recaptured repeatedly over time.
Encounter Rate Model
An effort-based index — encounters per hour from survey logs (dogs, hours, distance walked). Best when you have search-effort records rather than full mark-recapture histories, and want to track relative trends.
Ready to explore the data?
Upload your capture-recapture datasets and start modelling kiwi population dynamics today.
Kiwi Modelling